Matomo: GDPR-friendly alternative to Google Analytics

Details
This article may contain outdated information as it was published 3 years ago.
Recent trends in web analytics and tightening regulations by the EU on privacy and data storage location have prompted many companies to consider new alternatives for their website tracking methods. In Finland, the field of analytics is transforming, and it is timely to question what kind of tools should be used in the future and what principles should be followed in data collection.
Free tools like Google Analytics have provided companies with comprehensive opportunities for studying and improving their website traffic for years. However, the cost of using these free tools is that the provider can also utilize the data for their own purposes. There are also no guarantees of service continuity. Examples of this include the discontinuation of Google Universal Analytics on July 1, 2023, data usage restrictions in Looker Studios, and the upcoming end of support for the Google Optimize tool used for A/B testing.
Matomo offers stronger data ownership
For the reasons mentioned above, many now consider switching to new website tracking methods that allow for stronger data ownership and better control over data storage location. Especially for public sector organizations, Matomo may be worth considering, as it enables both cloud-based tracking and analytics installation on one’s own server. The visitor data collected through Matomo is processed and stored either in Europe or on one’s own server.
For those transitioning from Universal Analytics, Matomo is a favorable option, as the tool’s structure and report style resembles Universal Analytics in many ways. There are differences as well, but switching to Matomo might even be a lighter effort than migrating to the latest version of Google Analytics (GA4), which differs significantly from its predecessor.
Matomo also offers many features that are not present in Google Analytics, such as data backup from Universal Analytics to Matomo, A/B testing, heatmaps, and session recording capabilities. Similar to Google, Matomo has its own tag management system, Matomo Tag Manager, but you can also use Google Tag Manager to implement tracking.
Matomo’s basic reports
Matomo offers a freely accessible demo account that can help you better understand this section. With the demo, you can explore Matomo’s user interface and all the reports described below.
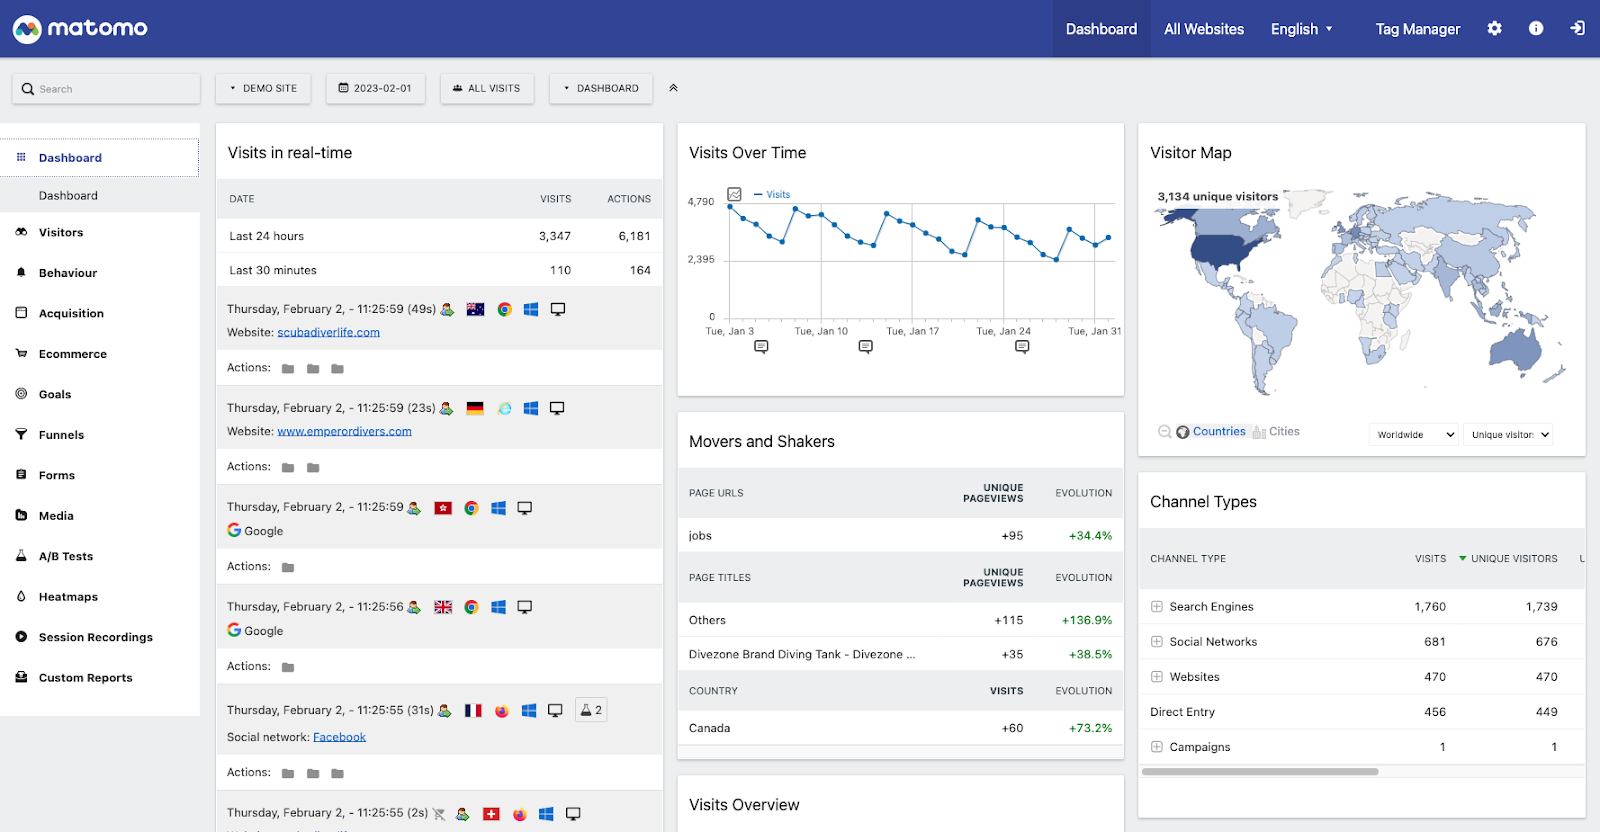
Upon logging into Matomo for the first time, you’ll see the Dashboard, which provides an overview of all the collected data. This view covers real-time data on the latest site visits, a summary of longer-term visits, the channels from which users arrive, and user locations. You can customize the Dashboard by rearranging elements or adding summaries of different reports, known as widgets.
The Visitors section in the left navigation consists of reports about site visitors and the devices they use. Real-time reports are also located here. Unlike Google Analytics, the reports are based on more technical data, so demographic information like age, gender, or Google search-based interests is not included. However, Matomo’s user reports provide interesting and useful data, such as location (country, province, or city level), visitor devices and operating systems, as well as visit times.
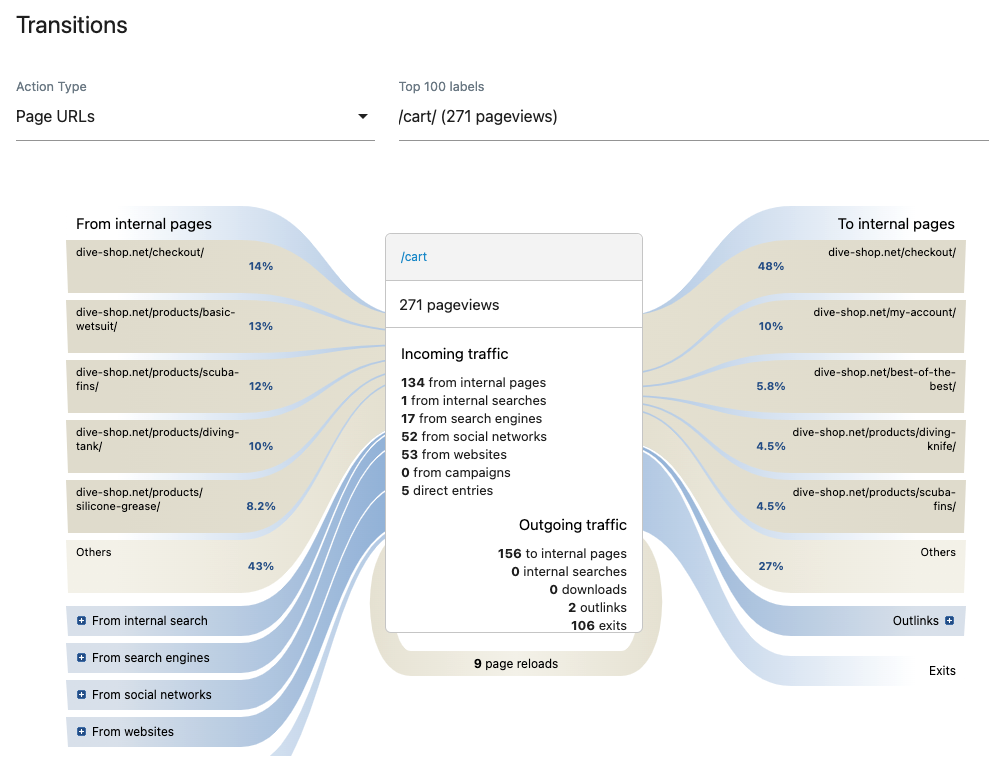
The Behaviour section is similar to Universal Analytics’ behavior reports. Here, you’ll find reports on the most visited pages, landing and exit pages, as well as visualizations of visitor paths. Separate reports are available for site events and interactions. These include site search usage, clicks on links leading outside the site, and file downloads.
The Acquisition section contains acquisition reports, which indicate how visitors have arrived at the site. The channels are categorized similarly to Universal Analytics: direct traffic, search engine traffic, referral traffic, and social media traffic. By integrating Google Search Console with Matomo, you can also bring the most traffic-driving keywords into their own report. It’s also possible to track your own campaigns, and for creating campaign links, Matomo has its own Campaign URL builder tool. When tracking campaigns, it’s important to note that Google’s UTM parameters are not compatible with Matomo.
The Ecommerce, Goals, and Funnels sections focus on measuring the website’s key events, or conversions. Depending on the site’s purpose, a conversion can be a product purchase, a contact form submission, or any other significant event relevant to the business. Conversion paths can also be turned into funnels to measure user progression and conversion through multiple pages or stages, such as in the case of an online checkout process.
Value-adding tools in Matomo
In addition to basic data, Matomo offers interesting tools for exploring website functionality. For example, Matomo has built-in support for conducting A/B tests, allowing you to investigate how different actions, visual elements, or content perform with your audience based on data. However, using this tool for A/B tests does require some coding skills, so it may not be the optimal choice for everyone.
Heatmaps and recordings allow you to tangibly track the points visitors click on the site and the paths they take. Matomo’s heatmaps and recordings are somewhat reminiscent of Hotjar’s functionalities, but a little simpler.

Custom reports enable the creation of customized report templates. With custom reports, you can filter, for example, a specific section of the site for separate analysis or examine how different types of visitors behave on the site. Since editing options are limited in the basic reports, it’s advisable to focus your analysis here.
Useful and relevant data for website analysis
After familiarizing yourself with Matomo’s reporting and understanding its functionalities, the tool becomes clearer and more user-friendly with each use. Particularly for users accustomed to Google’s Universal Analytics, Matomo will likely feel familiar and relatively easy to use.
Based on our experience, Matomo has good basic reporting and surprisingly effective integrations with other analytics tools, such as Google Search Console. Overall, Matomo is simpler than Google Analytics. Matomo’s features are not as versatile, so reporting and some functionalities may initially feel somewhat rigid. For example, it’s not possible to add secondary dimensions to basic reports for deeper qualitative analysis. However, the reports include useful and relevant data for supporting website analysis while also respecting visitor privacy.
Are you interested in implementing Matomo on your company’s website? Feel free to contact us, and our analytics team will be happy to assist with any Matomo-related questions!