
This article may contain outdated information as it was published 9 years ago.
The awesome WordCamp Helsinki was organised yesterday. I gave a lightning talk about “Growing pains of a WordPress agency”. Check WordCamp Helsinki site for the full schedule.
Just out of curiosity I wanted to count how many times people tweeted about each presentation. I searched for tweets with an official hashtag #wchel and exported them to Google Spreadsheet. I only counted tweets sent during the event. Then I manually went through all about 400 tweets (so there’s room for an error), categorised them and created statistics. Here’s the end result in chronological order:
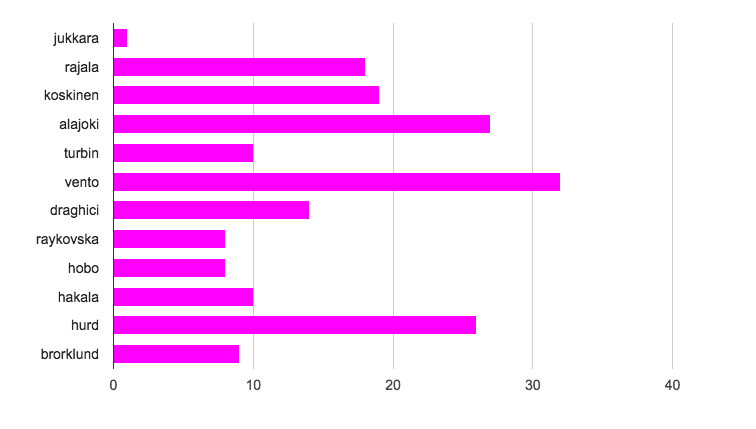
I’m happy to see that my presentation was one of the most tweeted. Apparently is was interesting 🙂 Although this chart is not completely fair since some of the presentations lasted for 15 minutes and some 45 minutes. So I also created a chart for tweets per minute. Shorter presentations are the green ones.
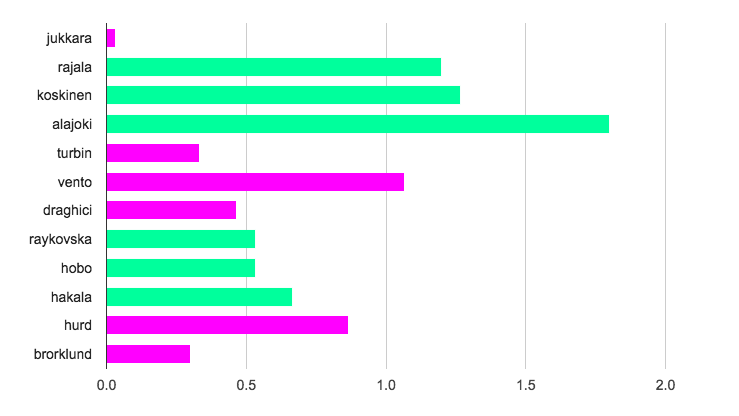
You can clearly make a conclusion that people fell asleep in the afternoon 🙂